2.1: Quality Debt - The Silent Killer Behind Your Release Velocity
Author: Christine Anderssen, DevOps Release & Test Manager, Afor
Outline
Quality debt vs technical debt
Why defects get exponentially more expensive
Three red-flag symptoms you cannot ignore
A local New Zealand case snippet
Self-assessment checklist: where do you sit on the curve?
Background
“For more than 20 years I have sat at the junction of delivery deadlines and quality gates, leading release trains, scrum teams, and test practices across banking, utilities, and public-sector programmes. When speed rules the roadmap, it is easy to forget that every unfinished story, every flaky test, and every untested edge case becomes tomorrow’s production incident.
I have made it my mission to help teams build quality in early, automate with purpose, and release without regret. In this series we will share the practical patterns and war-stories that have helped our clients turn chaotic release nights into quiet non-events – and reclaim their weekends.
This is the first of five blogs doing a deep dive into Test Management and Release Engineering each authored by one of our experts in the field."
— Christine Anderssen, DevOps Release & Test Manager, Afor
Introduction

Velocity maintenance - what to do to ensure speed is prioritised through early detection whilst en route
Sprint velocity is up, the backlog looks lean, and the product team is shipping features faster than ever. Yet support tickets keep rising, after-hours hot-fix sprints are the norm, and customers grow wary of each “seamless” release.
Welcome to quality debt – the hidden cost of accelerating delivery without equally investing in structured test management and release governance.
Unlike technical debt, which accrues through shortcuts in code to meet deadlines, quality debt accumulates when defects escape and compound downstream.
IBM estimates that defects uncovered during maintenance cost up to 100× more to fix than those caught in design or early test stages. Every delayed bug-fix diverts developer capacity, slows future sprints, and quietly erodes both trust and profitability. Today we surface the scale of the problem, the key symptoms, and practical steps to quantify your own debt before it cripples release velocity.
1. Quality Debt vs Technical Debt
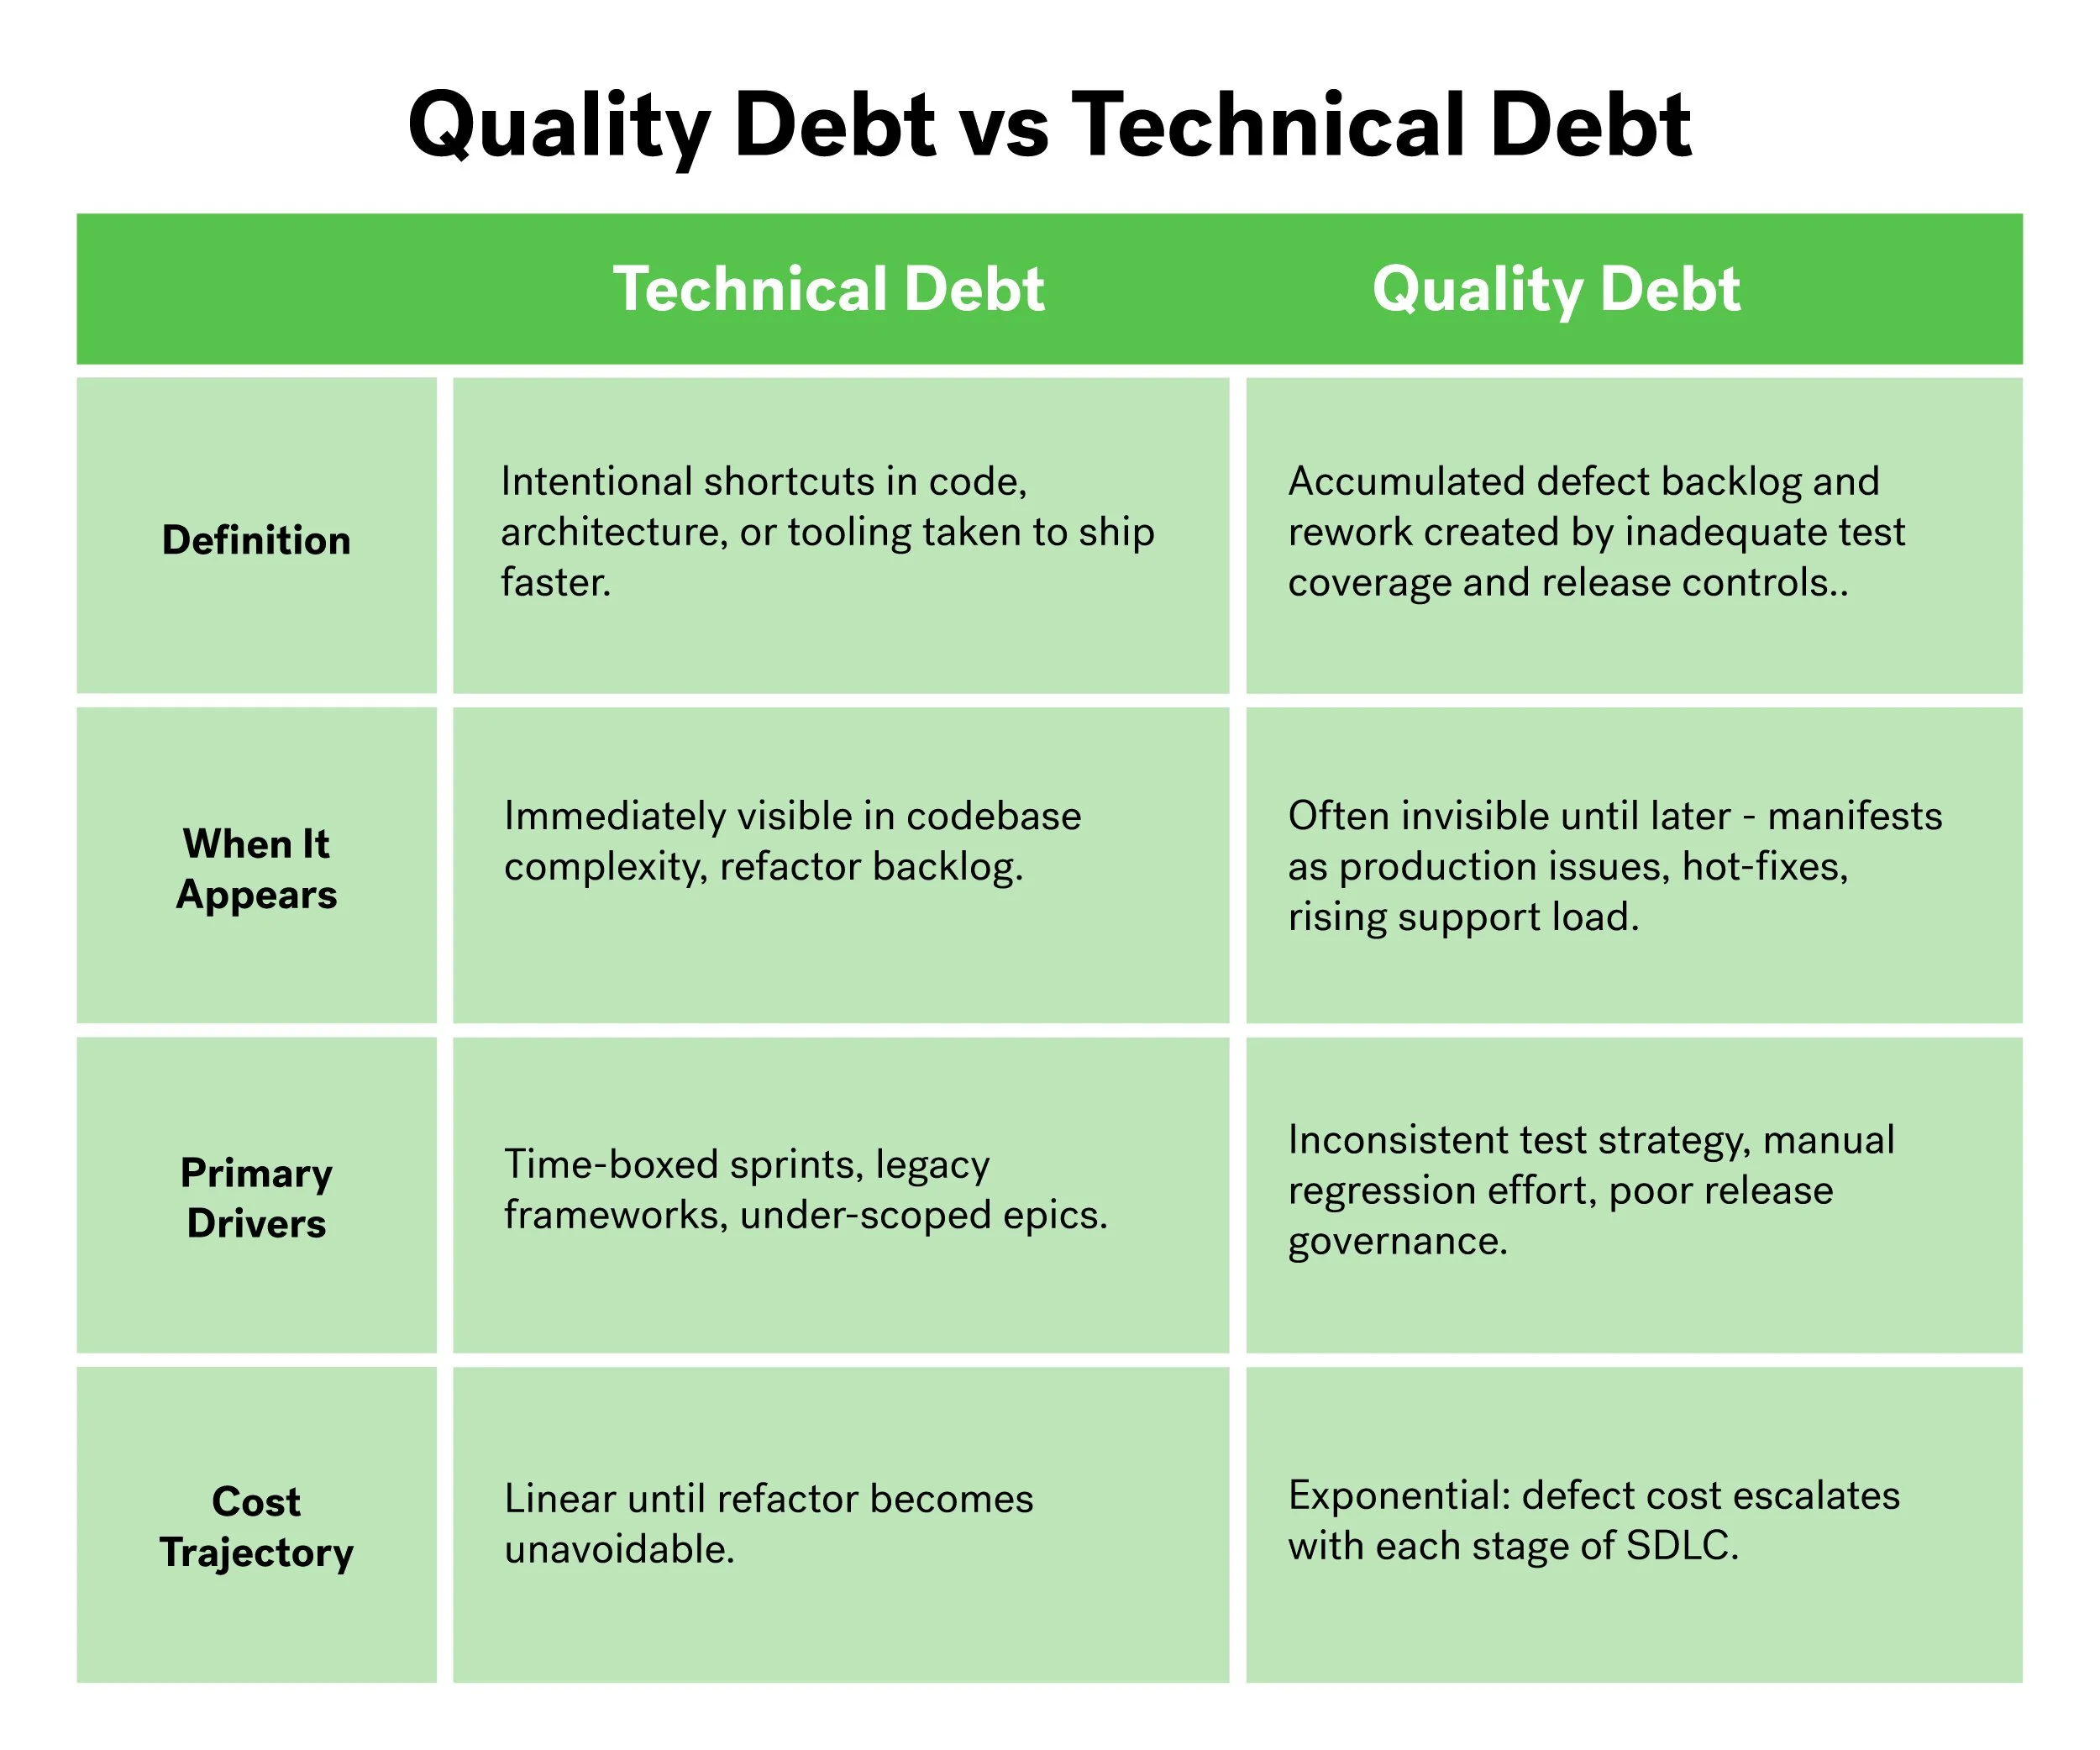
Both debts slow delivery, but quality debt is stealthier: it grows in the shadows while leadership celebrates velocity metrics.
2. Why Defects Get Exponentially More Expensive
Defects in software become significantly more expensive to fix the later they are discovered in the development lifecycle. According to IBM’s System Science Institute research, fixing a defect during testing can cost around 15x more than addressing it during design, and if left until the maintenance phase, the cost can rise to 100x the design-phase cost.
The financial impact of downtime caused by defects is substantial. Recent industry surveys show that over 90% of mid-sized and large enterprises report hourly downtime costs exceeding $300,000, with some organizations facing losses of $1 million or more per hour depending on their size and reliance on IT systems. Even for smaller businesses, downtime can result in losses of several thousand dollars per minute.
Beyond direct costs, every hour spent resolving production bugs is time not spent on innovation or delivering new features, which can slow business growth and erode competitive advantage.
Attempting to deliver software rapidly without robust, early-stage (shift-left) testing tends to push these costs further downstream, leading to increased support burdens, higher operational expenses, and potential damage to team morale and customer trust.
3. Three Red-Flag Symptoms You Cannot Ignore
1. Mounting Escaped Defects
Defects logged after release rise sprint-on-sprint despite velocity gains.
QA planning has gaps in test coverage for end-to-end, API, security or regression testing.
2. Reactive Hot-Fix Sprints
Emergency patches dominate sprint backlog, disrupting planned feature work.
Weekend or midnight deployments become “business as usual”.
3. Rising Support Tickets & SLA Penalties
Service desk volumes spike within 48 hours of each release.
Commercial teams face penalty charges or rebate discussions.
If two or more of these apply, quality debt is already draining capacity – and the compounding cost curve steepens every iteration.
4. Local NZ Case Snippet – When Speed Outran Quality
Over a 5-year partnership with a large client in the agri sector, Afor embedded dedicated Release & Test Managers (RTMs) across digital platforms servicing multiple projects.
The RTM-driven framework standardised staging rehearsals, sprint-readiness gates, and a single definition of “done” for all teams.
RTMs now sit as a permanent role on every project, ensuring production releases are faster, demonstrably higher in quality, and always preceded by a stakeholder sign-off meeting.
Mandatory staging environments and real-time release dashboards have replaced ad-hoc weekend drops with predictable, business-hours deployments that executives can trust.
5. Self-Assessment Checklist – Where Are You on the Quality-Debt Curve?
Give each statement a score from 0 (never true) to 5 (always true):
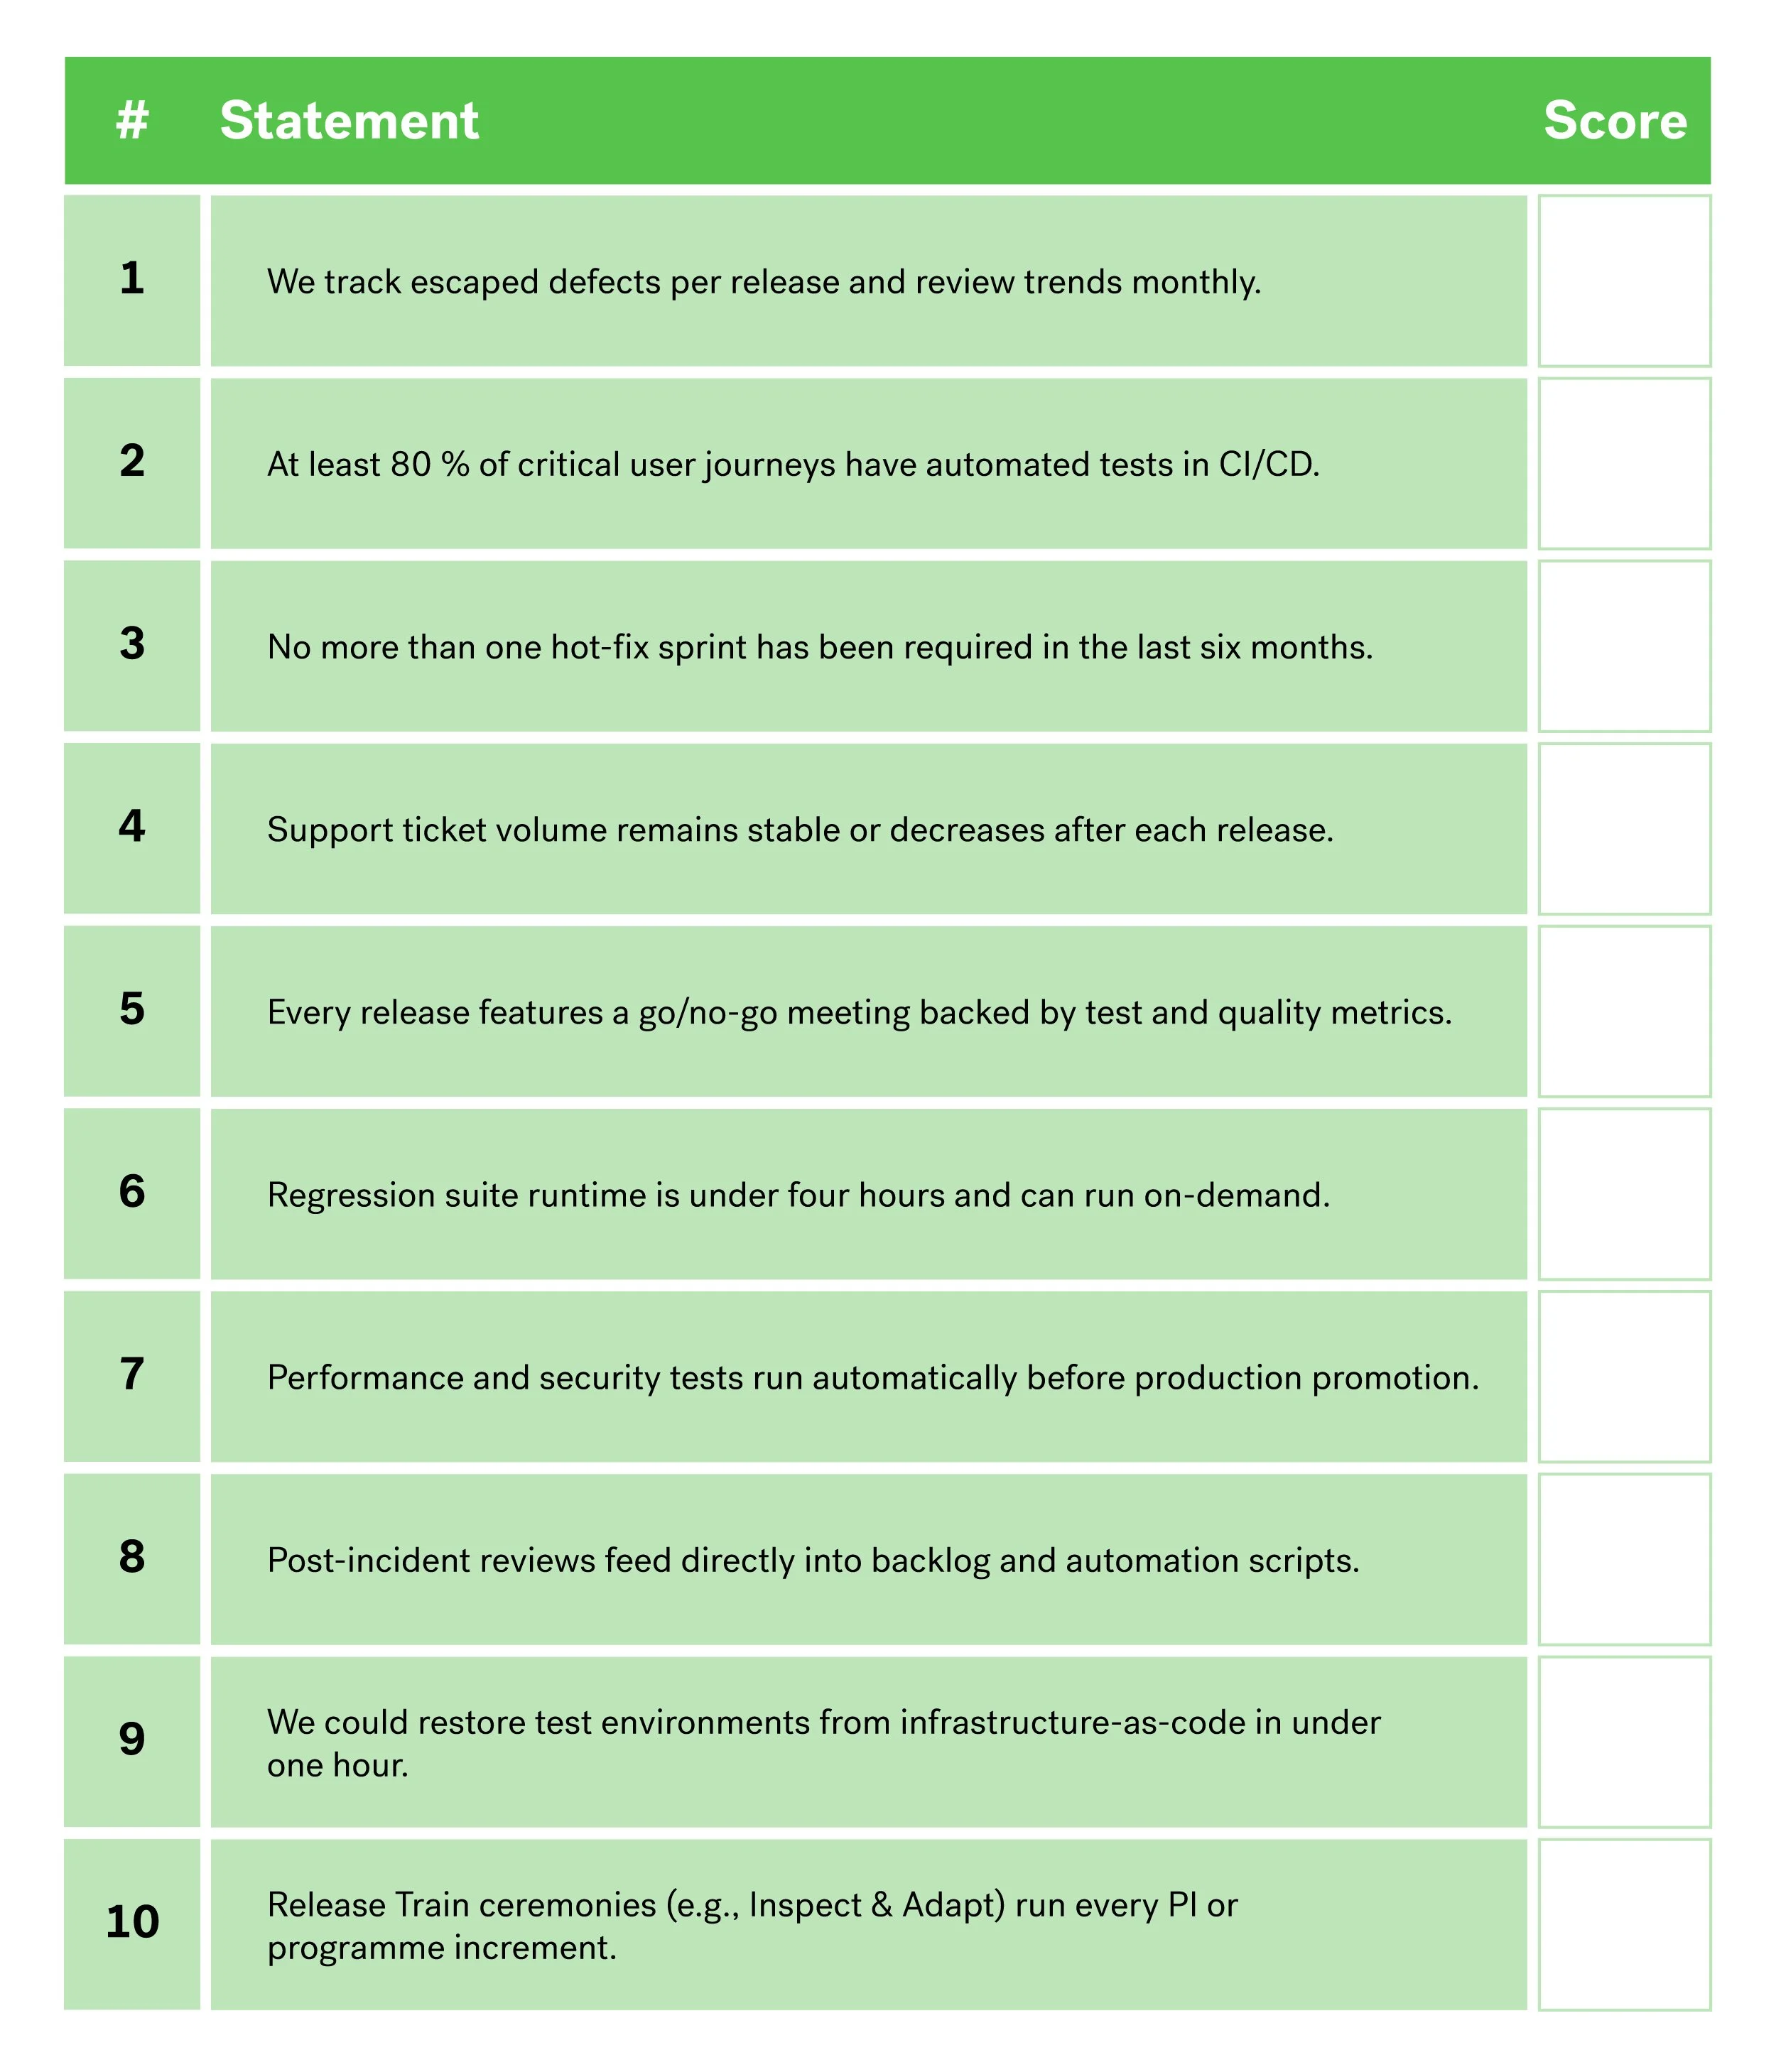
Scorecard:
0-20: Critical - quality debt is spiralling.
21-35: Concerning - symptoms visible, initiate test governance uplift.
36-45: Managed - continue investing in automation and release governance.
46-50: Leading - quality culture embedded; focus on predictive analytics.
Next Steps
1. Run a Retro on the Last Three Releases
Tally developer and QA hours spent on defect triage, rework, and hot-fixes.
Calculate the ratio of rework hours to planned feature hours.
2. Baseline the “Cost of Quality Debt”
Use the 10× and 100× multipliers for defects caught during test versus production to estimate avoided costs.
3. Plot Your Quality-Debt Curve
Chart defect-related effort over time. A rising trend signals urgent intervention.
4. Kick-Off a Shift-Left Experiment
Select one high-risk user journey. Automate functional and API tests in CI, run them at every merge, and compare escaped defects after two sprints.
5. Schedule a Stakeholder Debrief
Present the data, highlight lost opportunity cost, and secure sponsorship for a structured test and release management roadmap.
Pro tip: Keep evidence visual – heat-maps of escaped defects and capacity burndown charts resonate with executive audiences far better than lengthy narratives.
“When speed rules the roadmap, it is easy to forget that every unfinished story, every flaky test, and every untested edge case becomes tomorrow’s production incident.”
Closing Thought
Velocity is meaningless if each sprint deposits invisible liabilities in the form of unresolved defects and eroding customer trust. By shining a light on quality debt now, tech leaders can protect both release speed and brand reputation before the curve bends beyond recovery.
Take the checklist, crunch your own numbers, and start the conversation – your next release (and your sleep schedule) may depend on it.
FAQs - Further reading on how to build capability in Software Test and Release Management
Blog 1: Quality Debt – The Silent Killer Behind Your Release Velocity
Blog 3: What Business Criteria should I use when Shortlisting Test and Release Partners?
Blog 4: From Pilot to Production – Crafting a Risk‑Proof Statement of Work
Blog 5: The First 90 Days – Locking in Wins and Scaling Your New Test & Release Capability